
◆ I manage the editorial social calendar and conceptualize, create, and publish daily social media content across Facebook, Instagram, LinkedIn, Twitter, TikTok, and more
◆ I publish content using social media management tools like Facebook Creator Studio, or third party scheduling software like HubSpot and SproutSocial
◆ I publish content using social media management tools like Facebook Creator Studio, or third party scheduling software like HubSpot and SproutSocial
◆ I stay on-the-pulse with social trends, new platform updates, competitors, and identify emerging platforms
◆ I create actionable plans to both grow and maintain followers and increase engagement on social media platforms
◆ I have a strong attention to detail with brand guidelines and consistency in copy, ensuring that all posts are accurate, punctual, proofread, and mission-aligned
◆ I can provide onsite coverage at events, or remote coverage of events, to capture photo, video and publish real-time content as needed
◆ I monitor performance analytics and create monthly report decks across all platforms by using native analytics, Google Analytics, Looker Studio, and reporting software like HubSpot
_______________________________________________
Influencer Collaborations
Influencer Collaborations
I collaborate with influencers and other strategic partners to amplify messaging reach and impressions. I coordinate the campaign from start to finish: scouting, reaching out, coordinating the visit, following up, and finally fostering ongoing relationships with the creators.
In 2023, I coordinated over 60 influencer campaigns for Dreamscape with the following results:
6M+ Views*
425k+ Likes
2.5k Comments
425k+ Likes
2.5k Comments
*I use a + because some creators choose to hide their numbers on Instagram, so there are more than are officially unaccounted for.
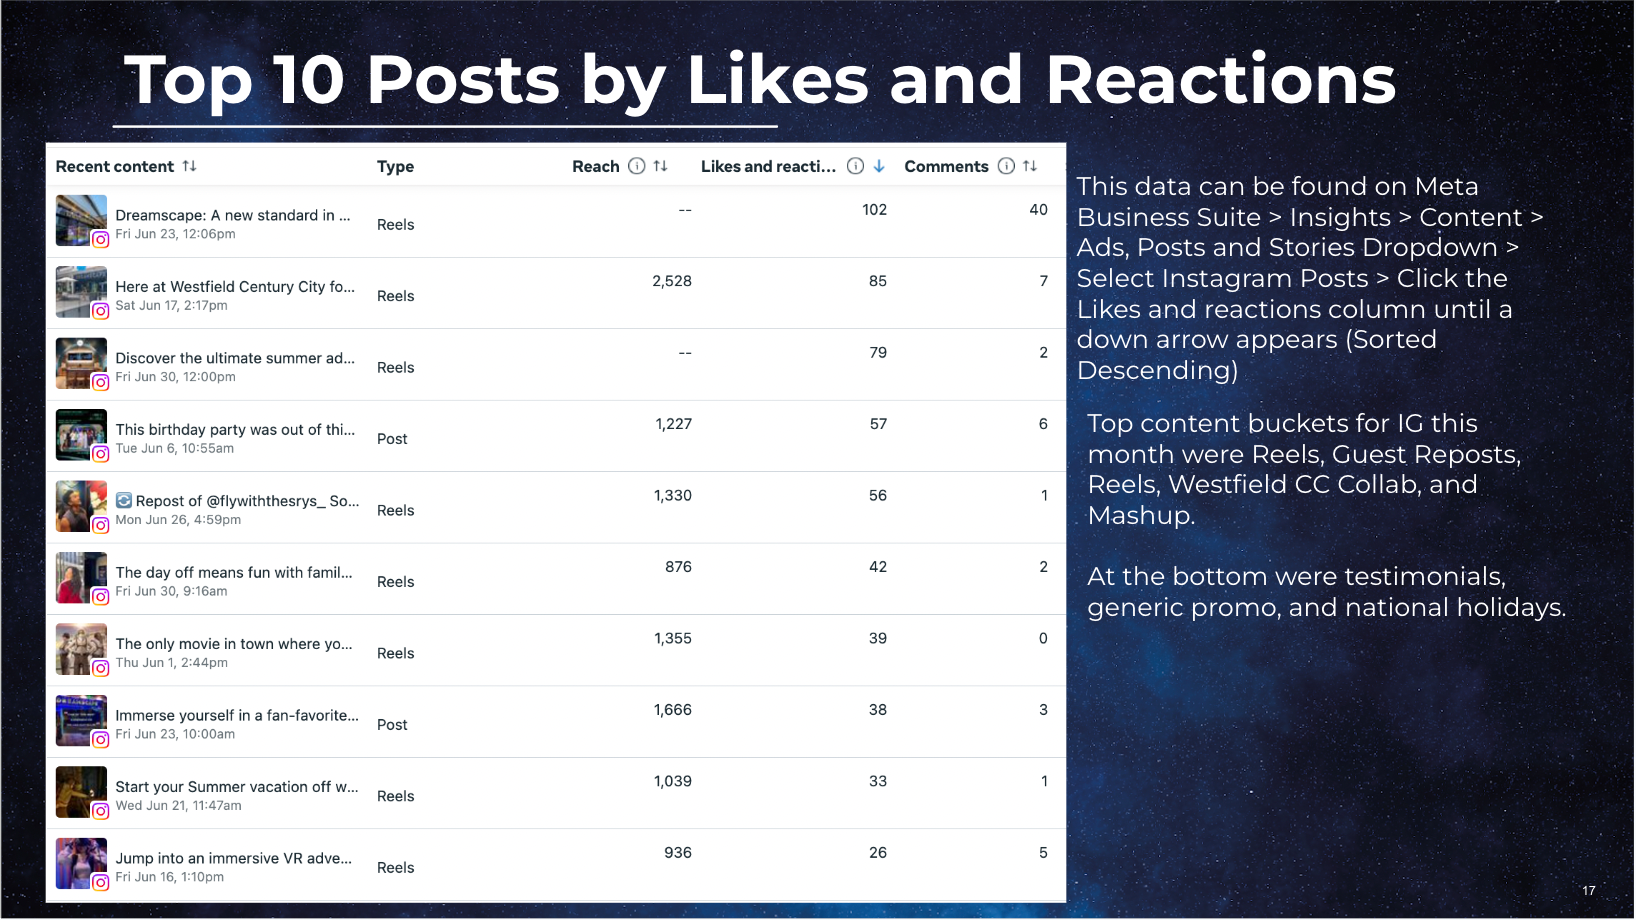
Collaboration Spotlight
@jenz_losangeles: Instagram Reel (3.1M views, 193k likes, 300+ comments)
TikTok (1.4M views, 190k likes, 612 comments, 29.5k shares)
TikTok (1.4M views, 190k likes, 612 comments, 29.5k shares)
@wherejaimiegoes: Instagram Reel (608k views, 3,386 likes, 43 comments)
@melissagasia: Instagram Reel (521k views, 24.5k likes, 95 comments)
@flywiththesrys_: Instagram Reel (39.6k views, 712 likes, 34 comments)
TikTok (16.9k views, 390 likes, 98 saves, 47 shares)
Valentine's Day Giveaway (19.8k views, 427 likes, 138 comments)
TikTok (16.9k views, 390 likes, 98 saves, 47 shares)
Valentine's Day Giveaway (19.8k views, 427 likes, 138 comments)
@columbusdatenightguide: Instagram Reel (11.5k views, 228 likes, 129 comments)
_______________________________________________
Reels & TikToks
Short form, vertical video is king these days, and understanding things like the hook, how to sync the footage to music, using text, fun transitions, keeping the loop in mind, and occasionally hopping onto a trending audio is something I really enjoy filming!
Short form, vertical video is king these days, and understanding things like the hook, how to sync the footage to music, using text, fun transitions, keeping the loop in mind, and occasionally hopping onto a trending audio is something I really enjoy filming!
These are just a small sample of videos - see more by clicking on my TikTok icon in the footer!
_______________________________________________
Reporting
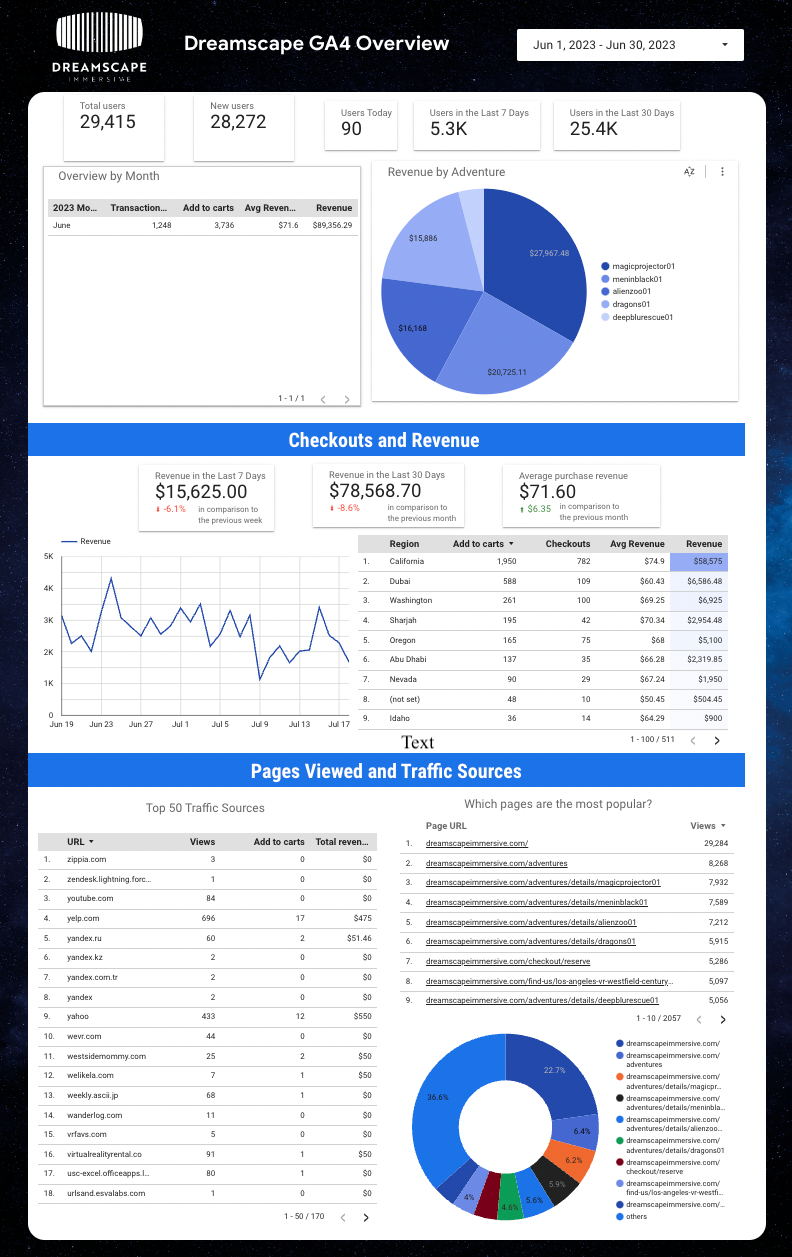
Google Analytics 4 (GA4) Report Created in Looker Studio
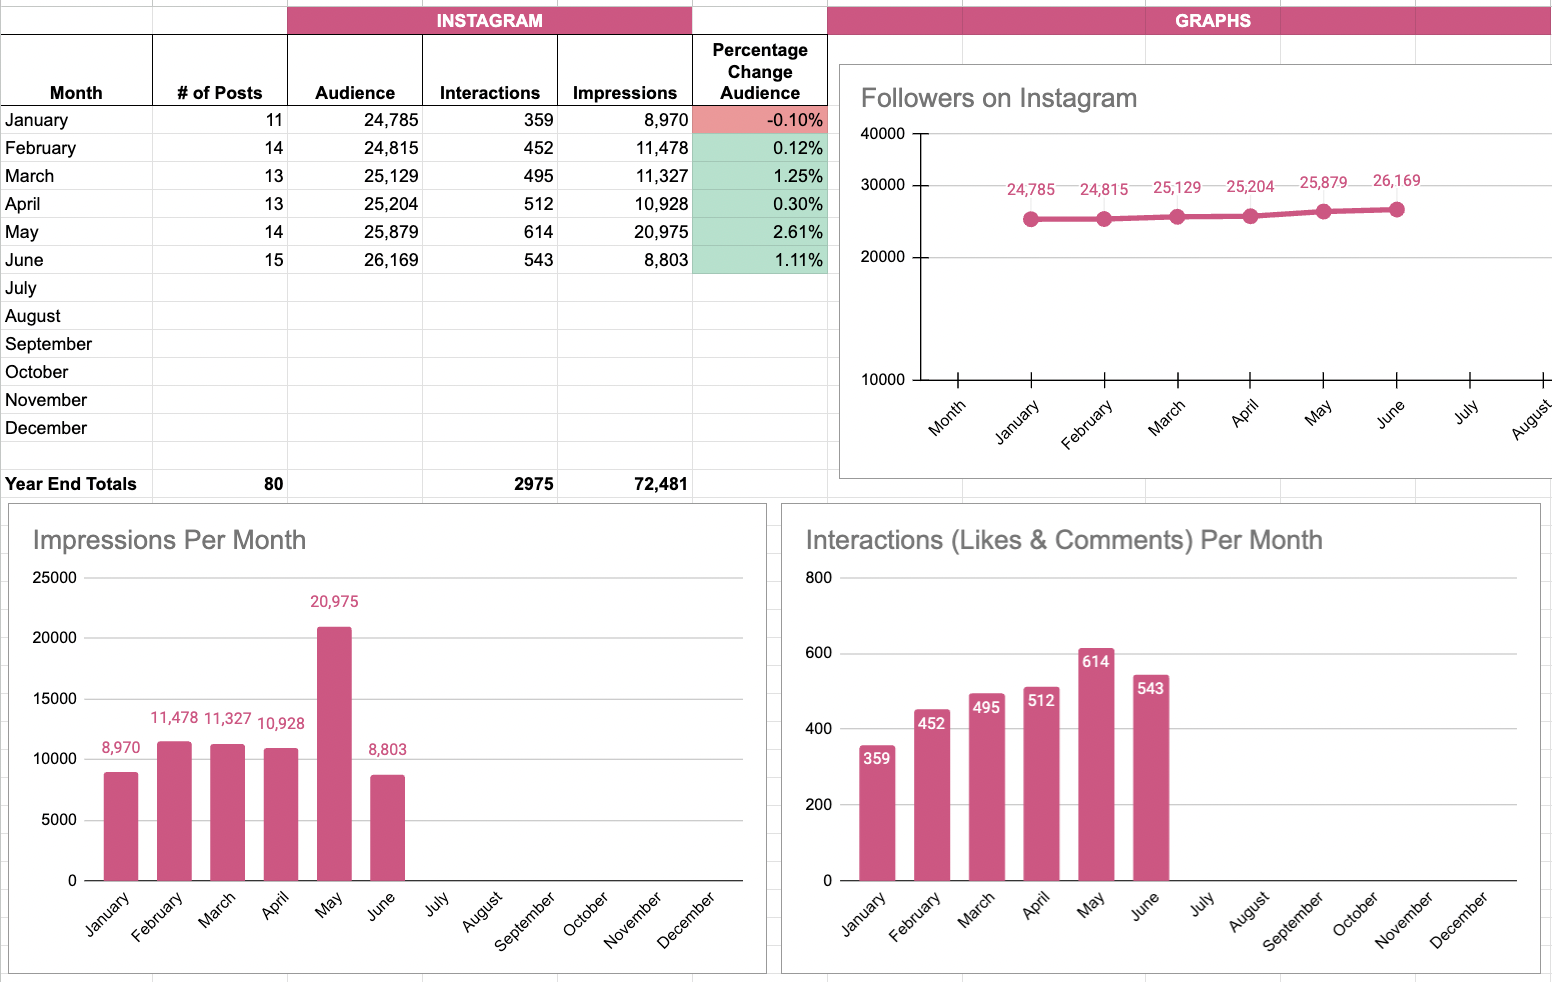
Monthly Tracker in Google Sheets
Page from a Monthly Social Media Report
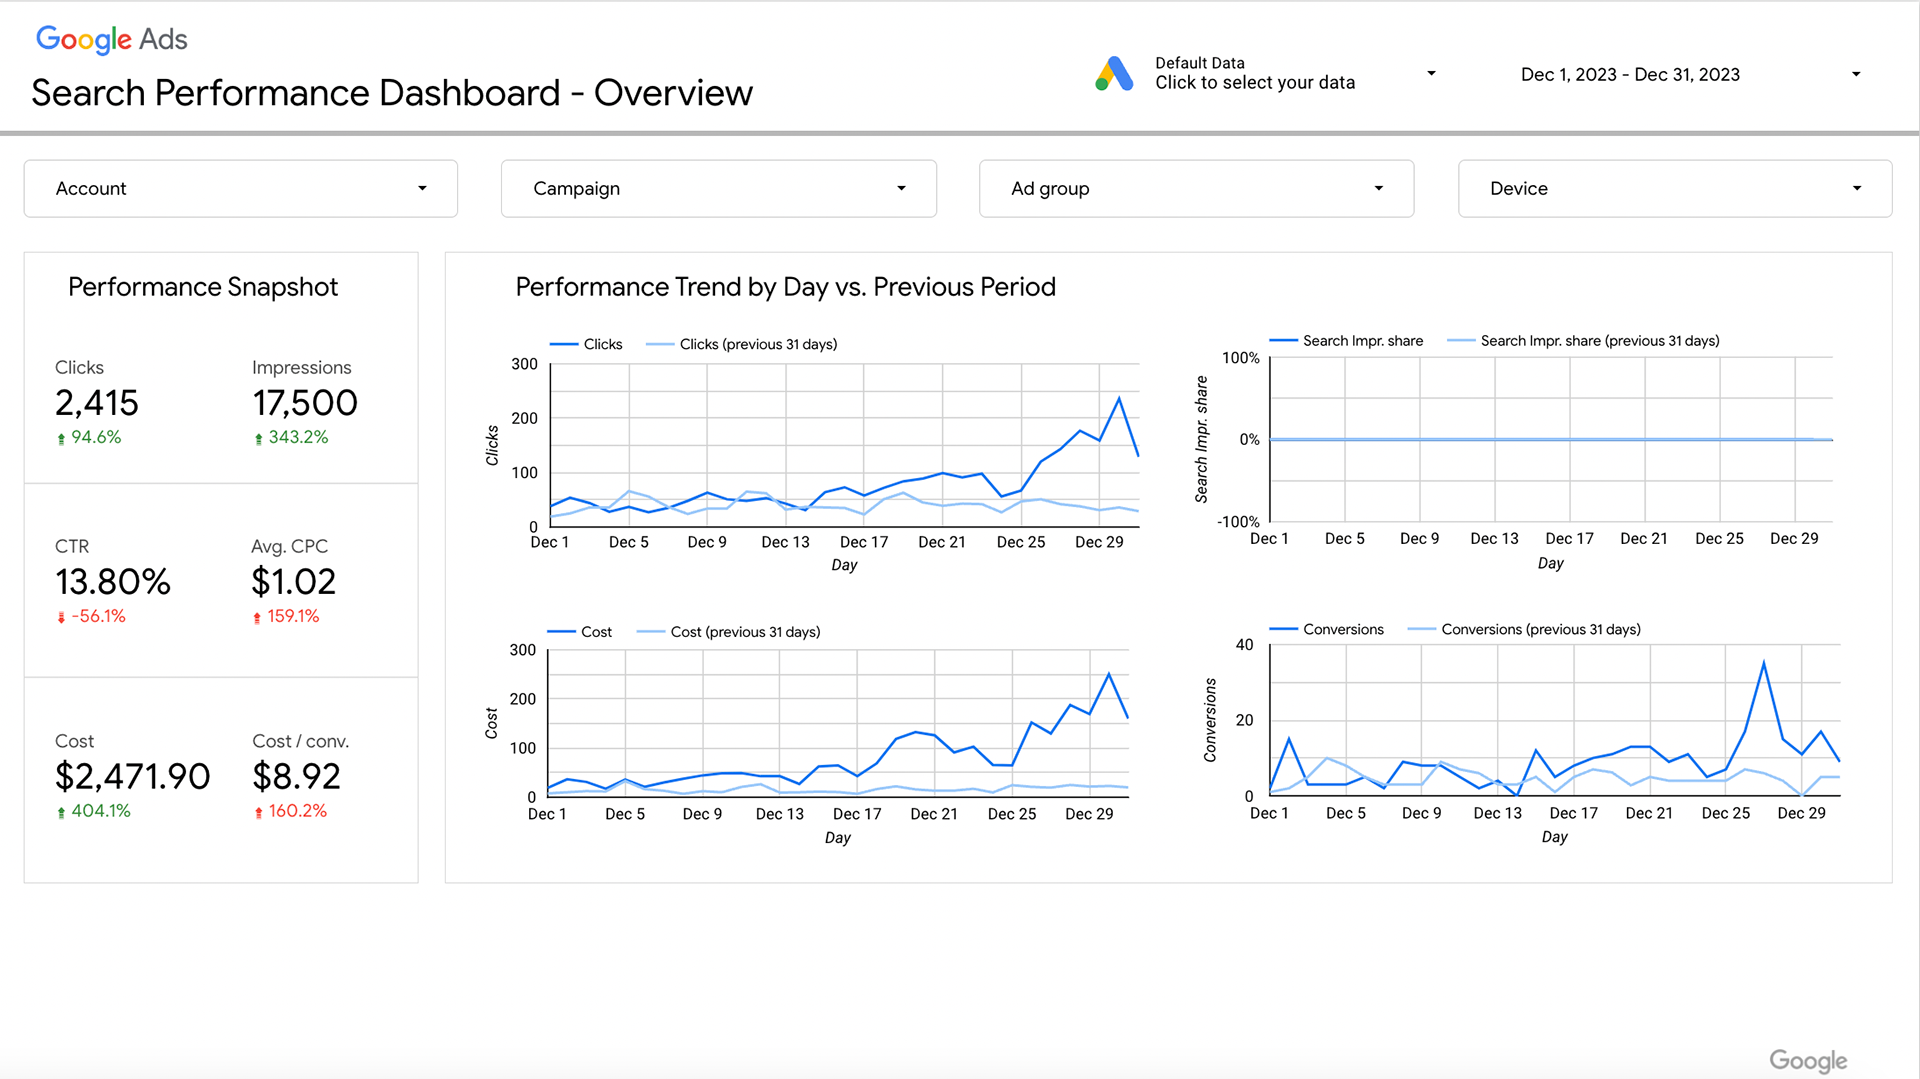
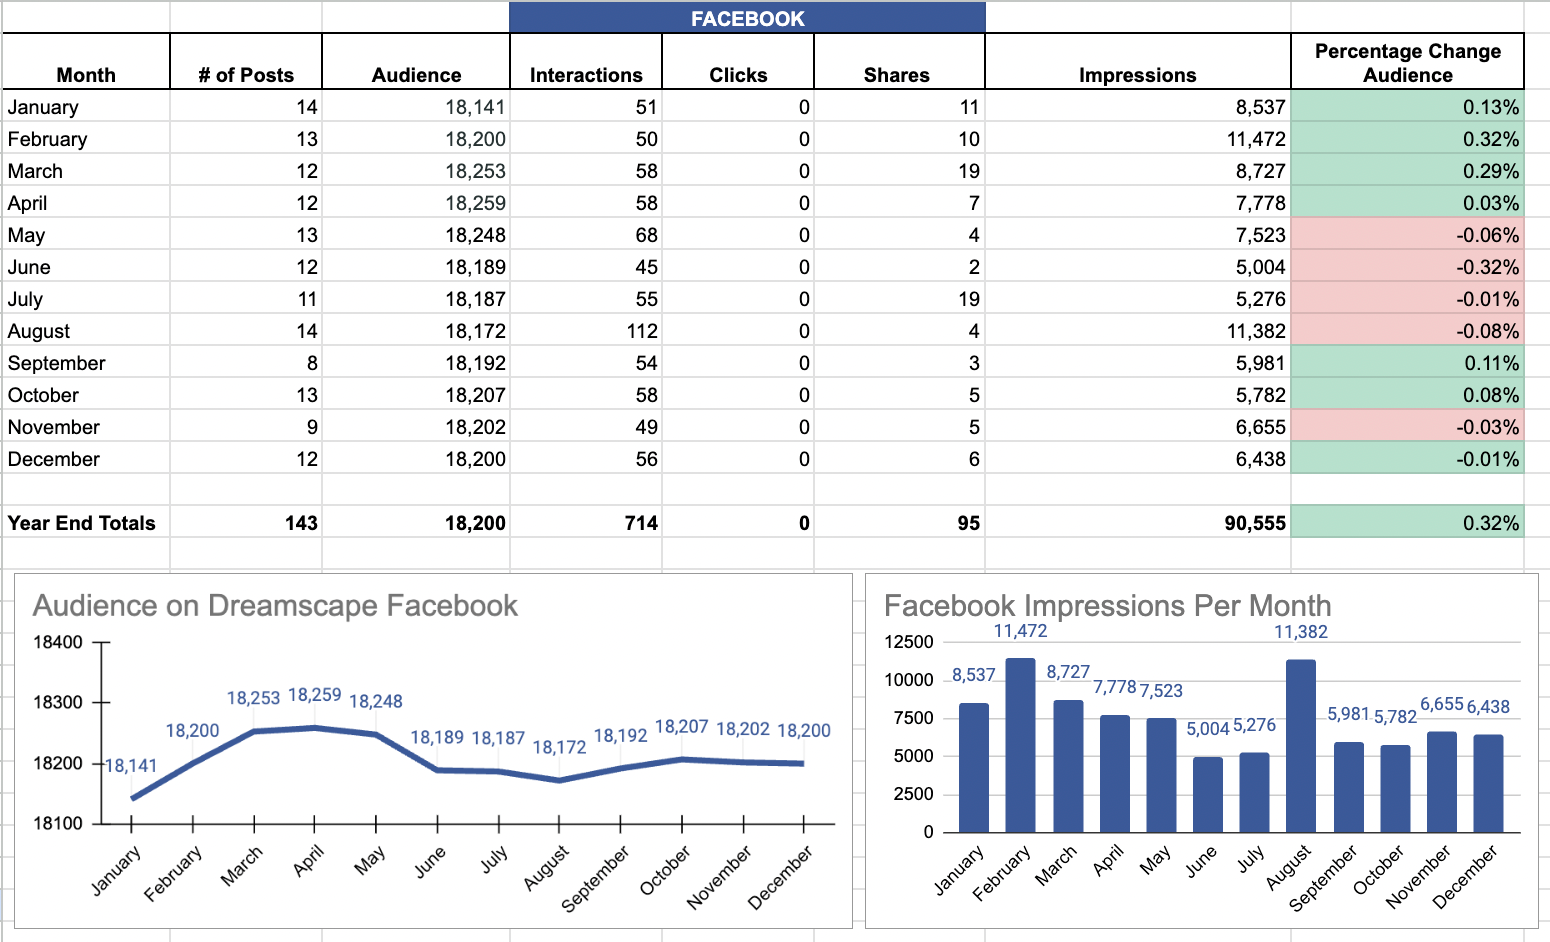
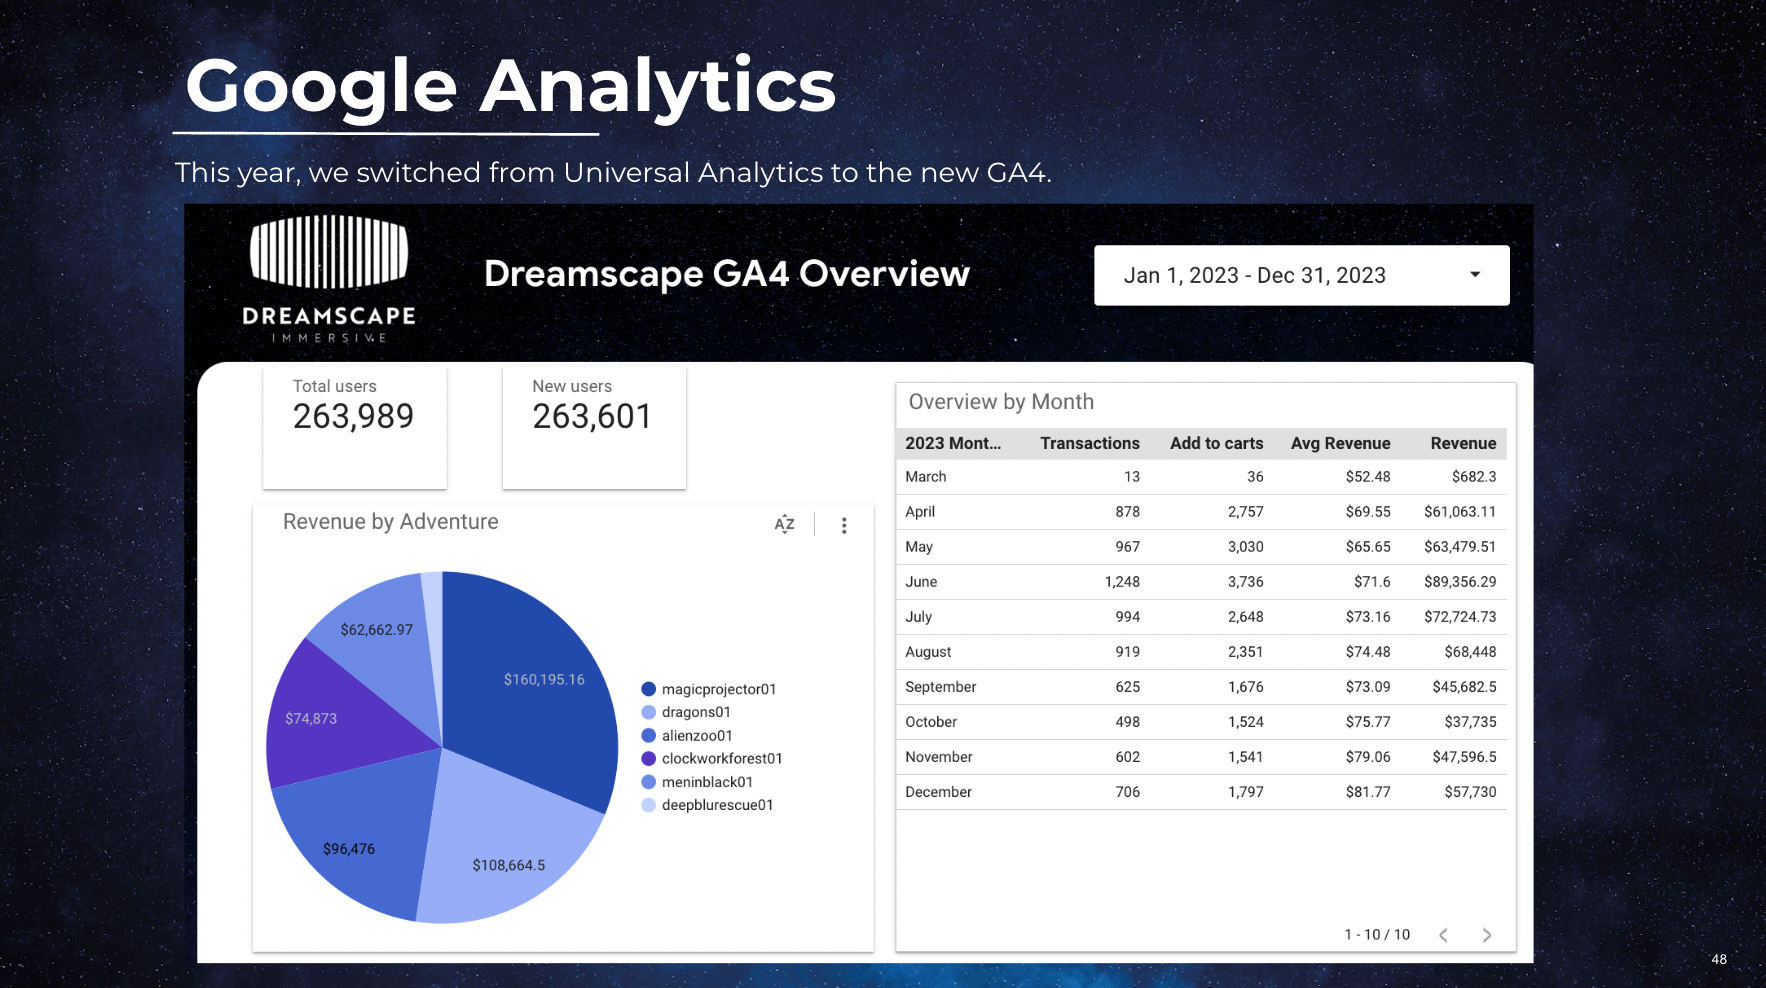
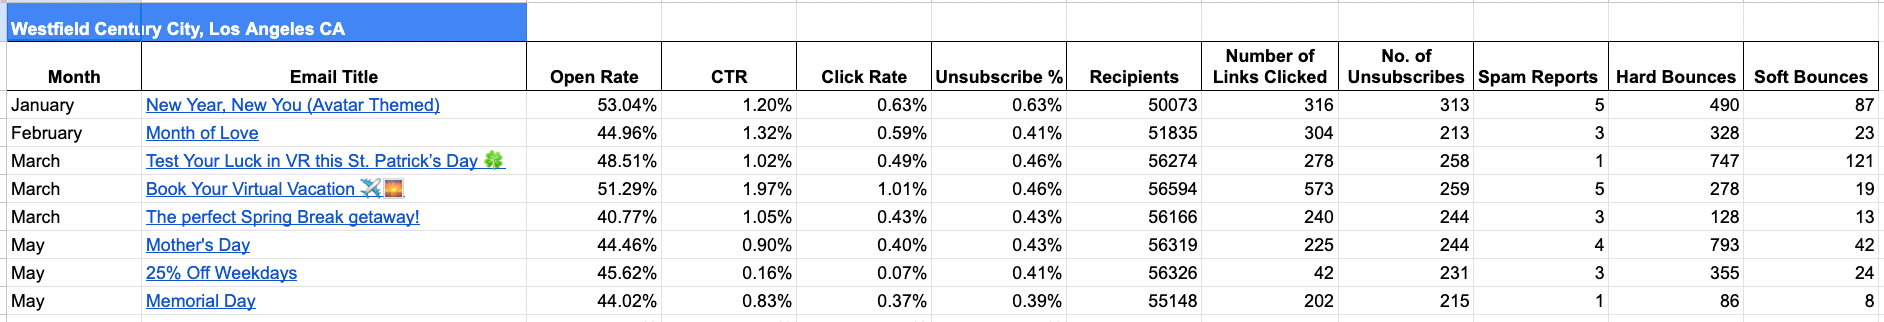
I create recurring monthly reports and suggest ideas for improvements on future campaigns and content. Within these reports I provide deep insights into email results and social media platforms, and have built out reports in Looker Studio for Google Ads and Google Analytics 4 (GA4).
Although I do deep dives each month, I also track activity over time in a yearly spreadsheet to get a macro understanding of account growth over time.
My reports include data on
◆ Instagram and Instagram Boosts
◆ Facebook and Facebook Ads
◆ Twitter
◆ TikTok
◆ LinkedIn
◆ Threads
◆ Google My Business
◆ Google Ads
◆ Google Analytics
◆ Email Results
◆ Facebook and Facebook Ads
◆ TikTok
◆ Threads
◆ Google My Business
◆ Google Ads
◆ Google Analytics
◆ Email Results
_______________________________________________
Email & Contact Management
I brainstorm email and newsletter ideas, upload the files to HubSpot, attach links, and include UTM tracking codes. I then create email reports that include the Open Rate, CTR, Click Rate, Unsubscribe %, Recipients, Number of Links Clicked, Number of Unsubscribes, Spam Reports, Hard Bounces, Soft Bounces, and Click Map.
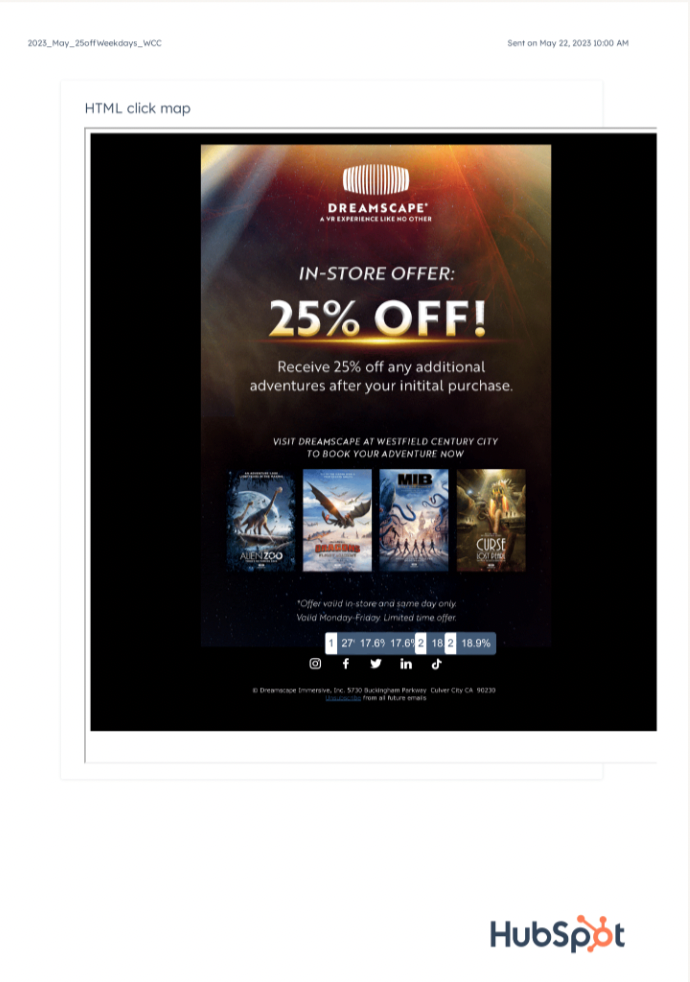
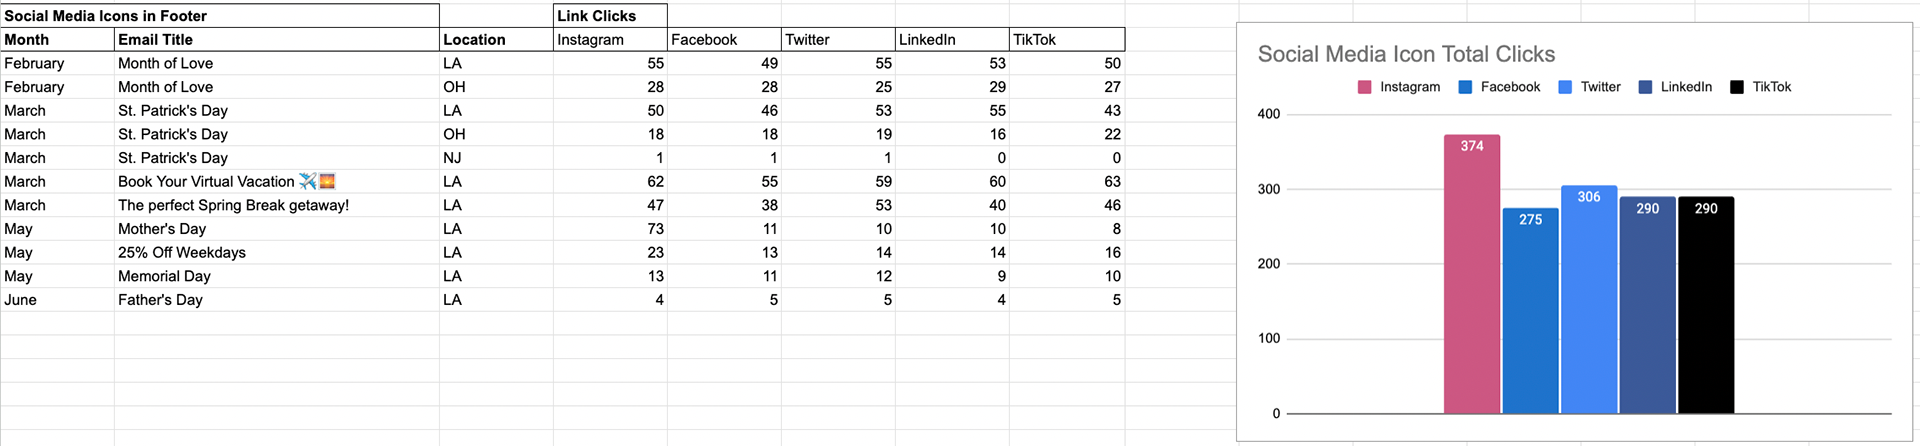
HTML Click Map
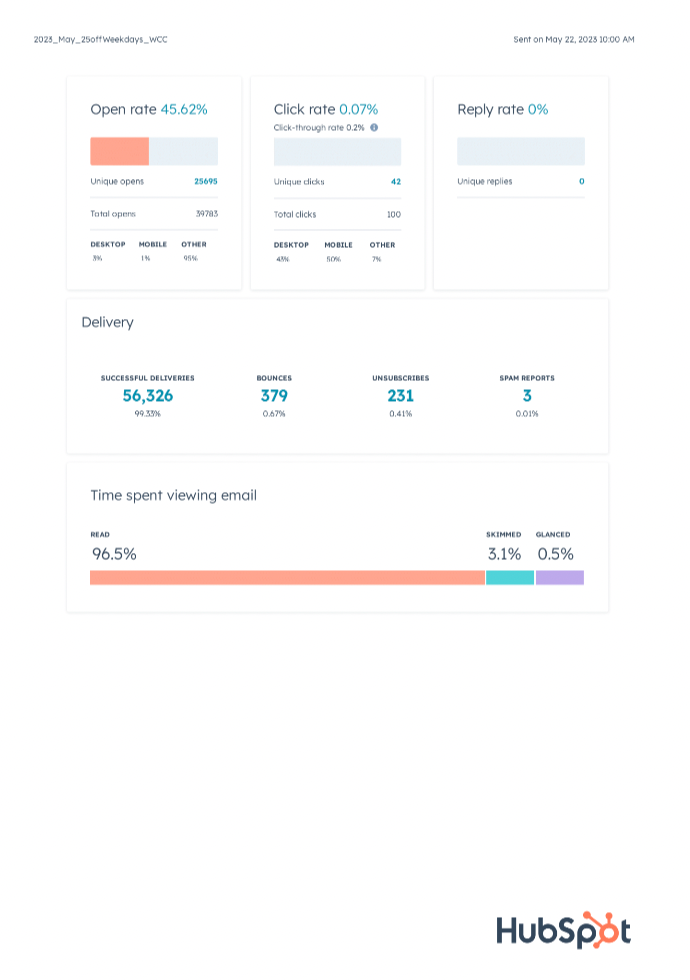
Summary
_______________________________________________
Paid Ads
I execute paid social campaigns across Instagram and Facebook, and use A/B testing to refine ad strategy, and create in-depth reports on the ad results
HomeSmart Facebook Ads Results
Average of $80 ad budget per month, per franchise
Ran Carousels, A/B Testing Ads, GIF, Video, and Photo Facebook Ads
for 19 HomeSmart Franchises using targeted demographic lists
to serve these ads to realtors in specific regions.
Ran Carousels, A/B Testing Ads, GIF, Video, and Photo Facebook Ads
for 19 HomeSmart Franchises using targeted demographic lists
to serve these ads to realtors in specific regions.
February 2022 - 19,684 people reached / 31,860 impressions/ 32 Link Clicks / $280 spent
March 2022 - 40,093 people reached / 95,190 impressions/ 367 Link Clicks / $1k spent
April 2022 - 16,227 people reached / 63,801 impressions/ 210 Link Clicks / $600 spent
May 2022 - 89,612 people reached / 231,340 impressions/ 484 Link Clicks / $2k spent
June & July 2022 - 36,688 people reached / 222,954 impressions/ 1,182 Link Clicks / $3k spent
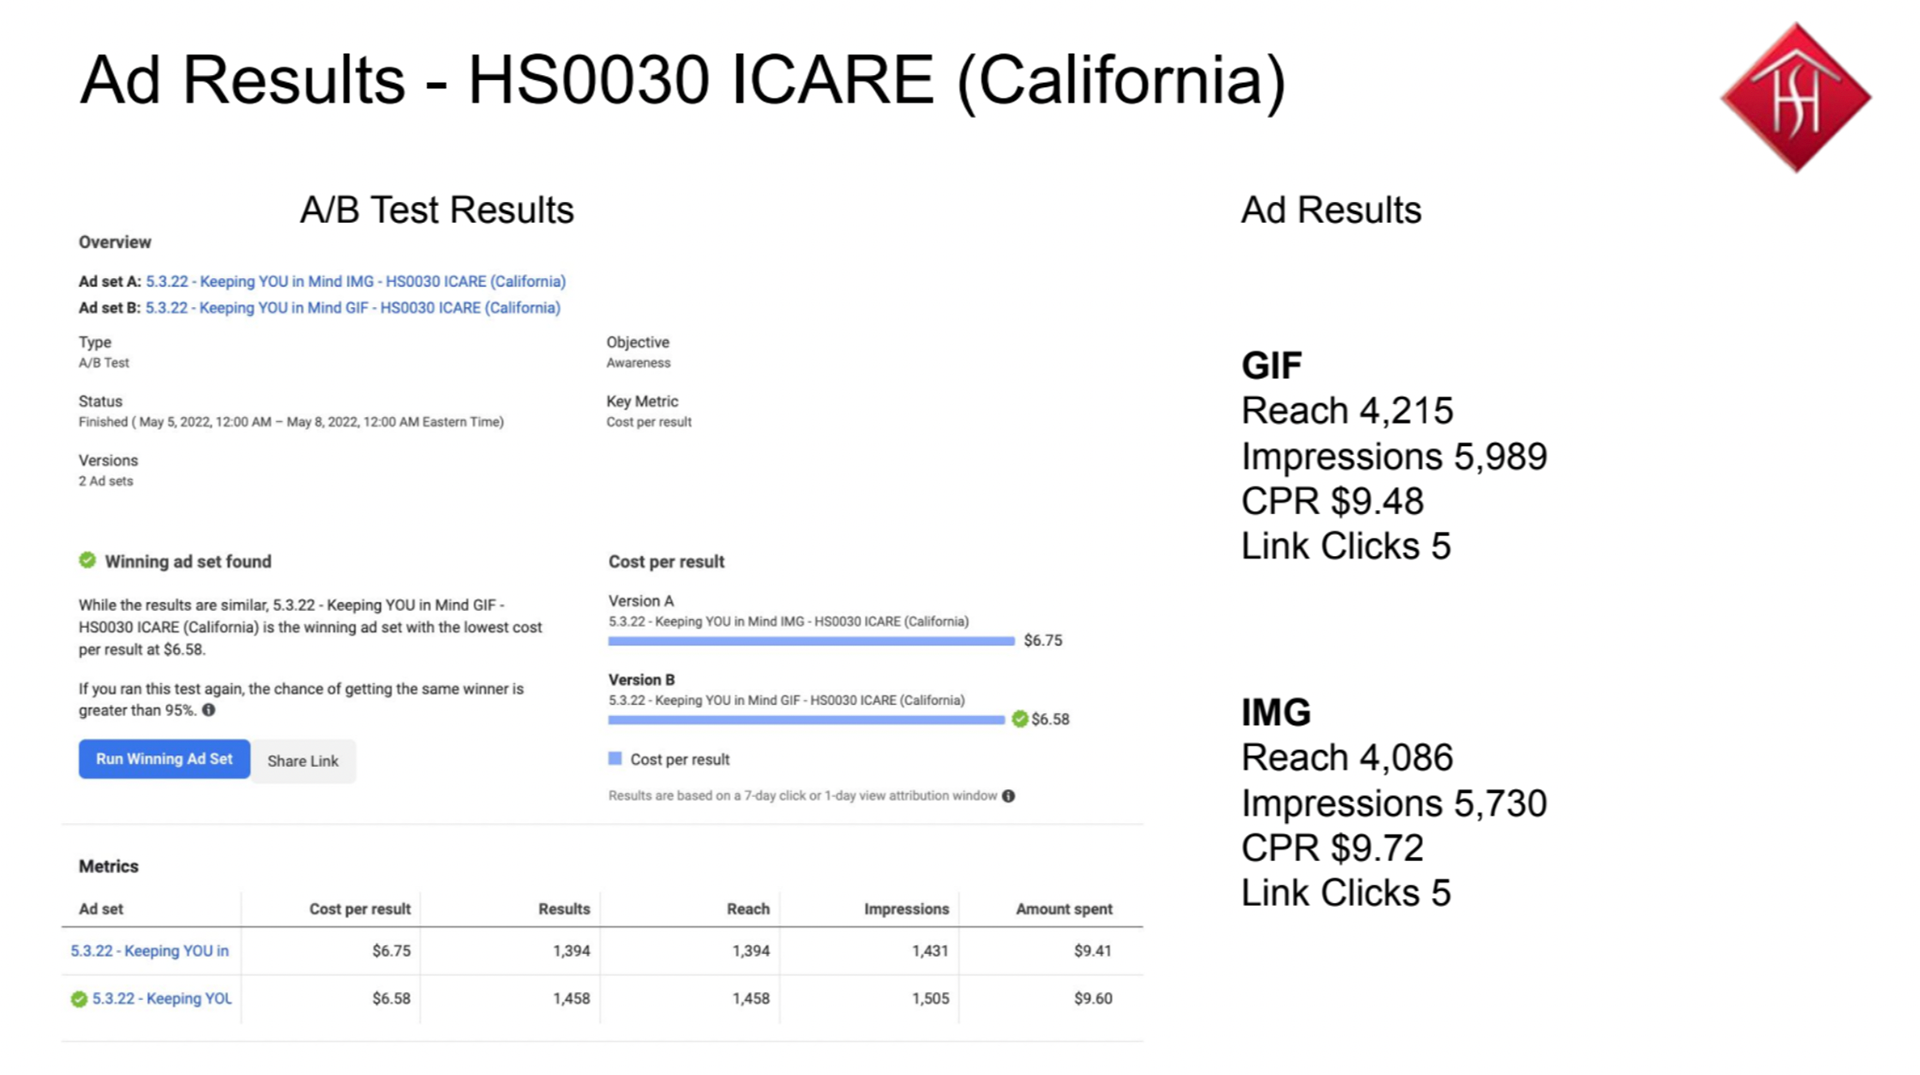
A/B Test for a Gif vs and Image Facebook Ad
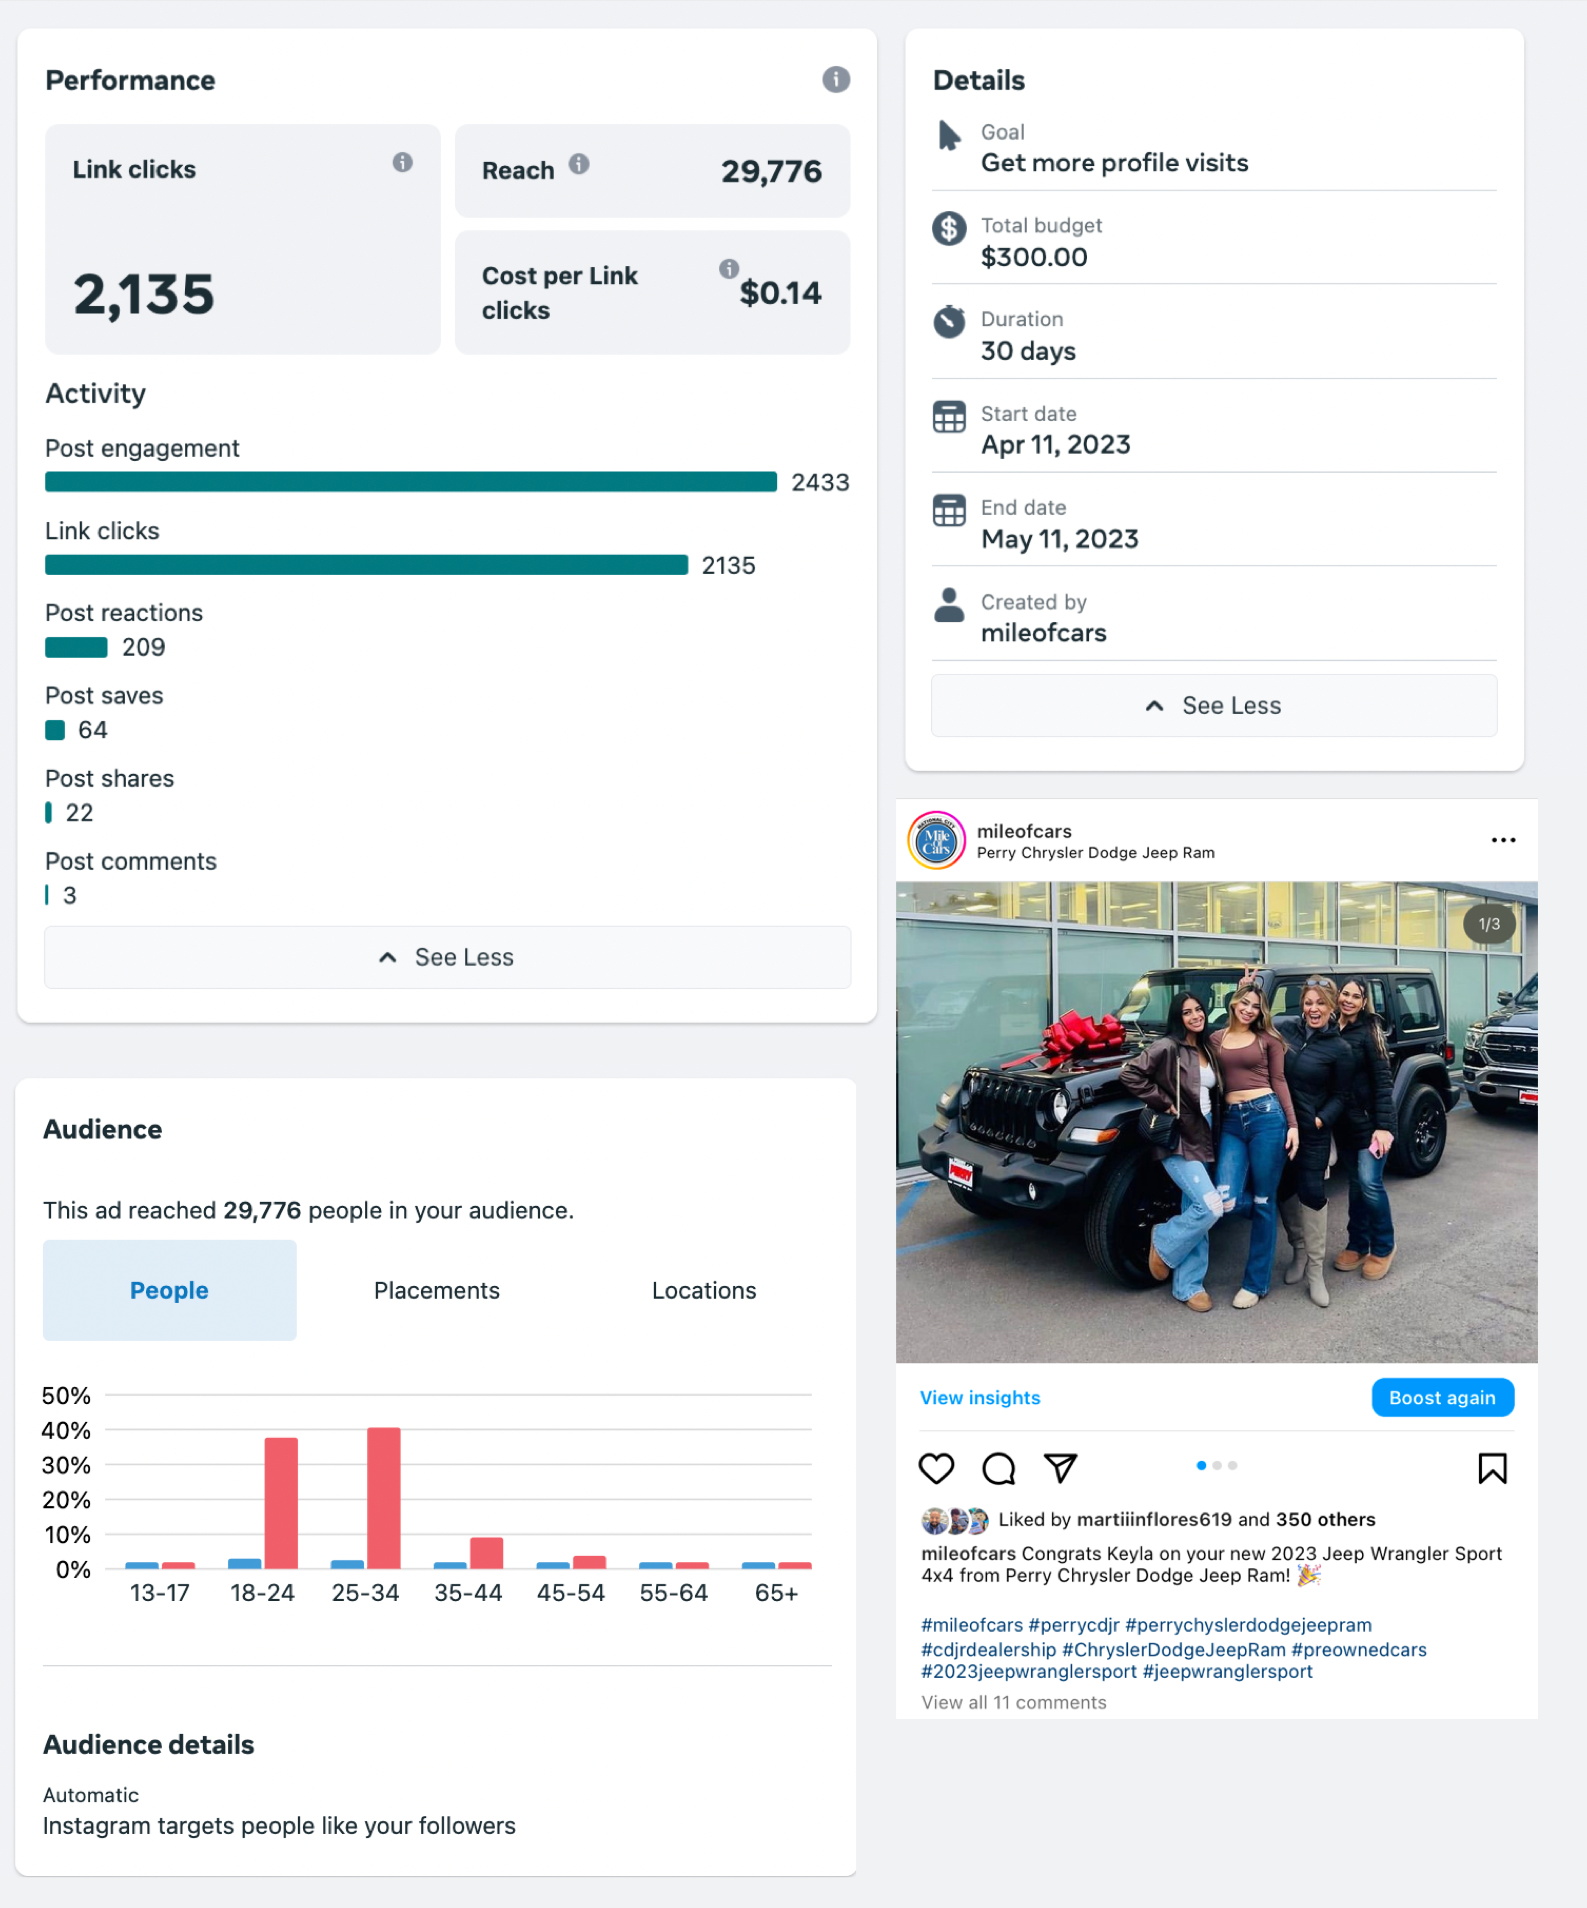
Instagram Boost Results
for Mile of Cars
I started at HomeSmart in August of 2021. They said they'd never seen these accounts grow so fast! This shows the importance of interactions and community building with other accounts instead of simply posting and walking away expecting growth, which is what they had been doing for years prior.
Both the Minute Mortgage and Equitable Title Agency Instagram accounts grew completely organically from less than 500 followers to over 2,ooo followers in under a year.
See the difference actually engaging on the ground level with these accounts makes in the charts below. Refer to the dotted line to see when I started working and the difference it makes in account growth!
See the difference actually engaging on the ground level with these accounts makes in the charts below. Refer to the dotted line to see when I started working and the difference it makes in account growth!